
# Prometheus 监控实战(一)
# 一、Prometheus 介绍
# 1.1 Prometheus 是什么
Prometheus 是由 SoundCloud 使⽤ Go 语⾔开发的时序数据库(简称 TSDB)但它的功能并⾮局限于 TSDB,因为它还⽀持对⽬标(如服务器、应⽤程序等)进⾏监控;
因此,我们也可以理解 Prometheus 是⼀款开源的 “监控系统”,但仅仅依托 Prometheus 不⾜以⽀撑整个监控系统,它需要结合⽣态内其他的组件来构建⼀个完整的 IT 监控系统。例如: AleartManager、Grafana、PushGateway 等等。
# 1.2 什么是时序数据
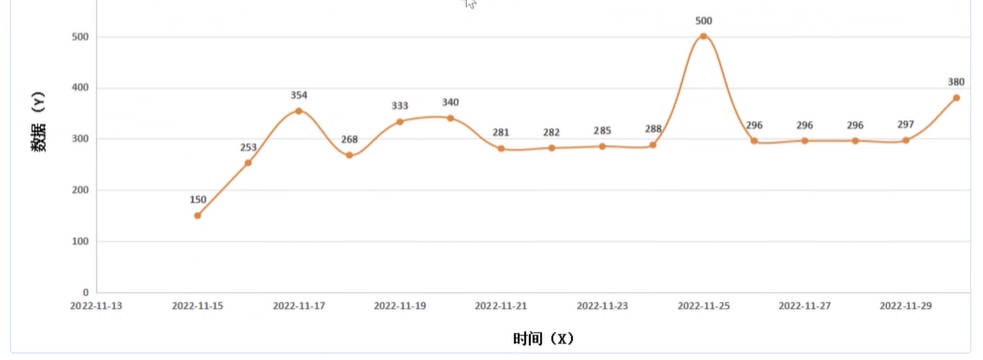
所谓时序数据,指的是,按照固定时间周期对 “某个或某些指标” 进⾏ “反复测量” 从⽽得到测量的 “数据集合”。这些数据随着时间的推移,会形成⼀个连续的序列,因此被称为时序数据。如果我们将这些数据绘制在图形上,通常会有⼀个 数据轴(Y 轴) 表示数据值,⼀个 时间轴(X 轴) 表示测量的时间点。
# 1.3 Prometheus 时序数据
在 Prometheus 中,时序数据主要包括三个部分:指标名称、标签集、时序数据(时间戳、数据)。
1、指标名称
例如,监控服务器的 CPU 使⽤率,对应的指标名称可以是 cpu_usage、memory_MemTotal 等指标名称是被监控端提供的。
2、标签集
标签集⽤于区分不同的数据源或实例。
假设我们有两台服务器,⼀台是 Web 服务器,另⼀台是 db 数据库服务器。为了区分这两台服务器的 CPU 使⽤率数据,我们可以为它们添加不同的标签,例如: cpu_usage {type="web"} 和 cpu_usage {type="db"} 。
3、时序数据
指按照按固定时间间隔,采集对应指标名称,从⽽获取到对应指标的数据。例如,每分钟采集⼀次 CPU 使⽤率( cpu_usage )。每个数据点包括采集 CPU 使⽤率的时间戳( 2023.03.30 10:00:01 ),以及该时间点采集到的样本值( 50% )。
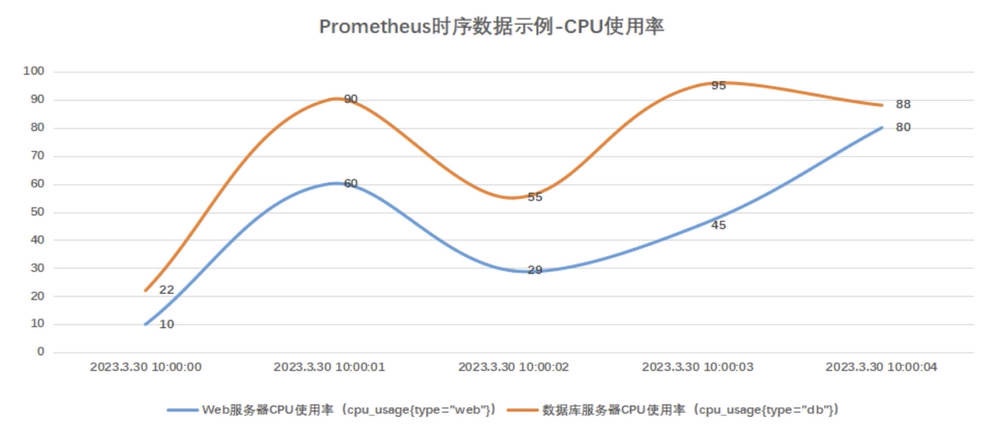
PS:每⼀个 “指标名称和标签组合” 都会形成⼀条独⽴的时间序列。这就表示,即使我们只探测了⼀个指标 cpu_usage ,但是它具有不同的标签值,就会产⽣两条分别代表不同实例的时间序列。在这些时间序列中,每⼀个特定的数据点被称为⼀个 ' 样本 '。每个样本都包含指标名称、标签、时间戳以及对应的指标值。
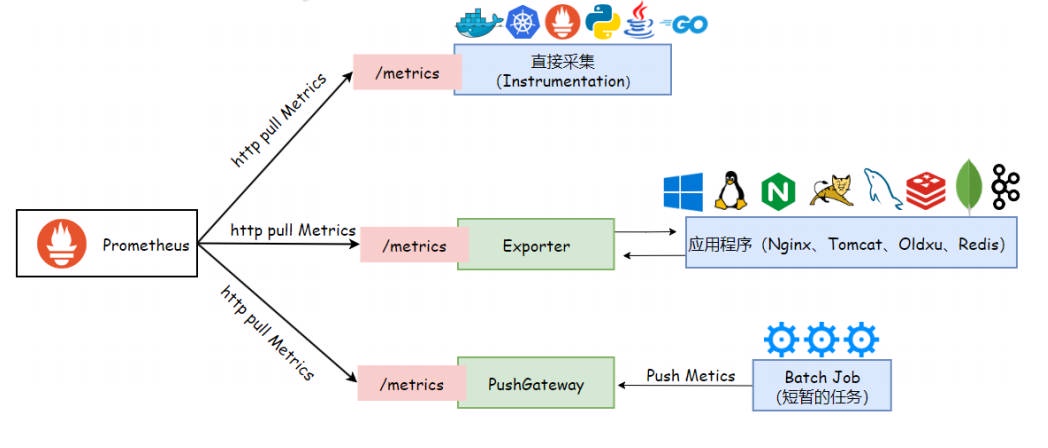
# 1.4 Prometheus 数据采集三种方式
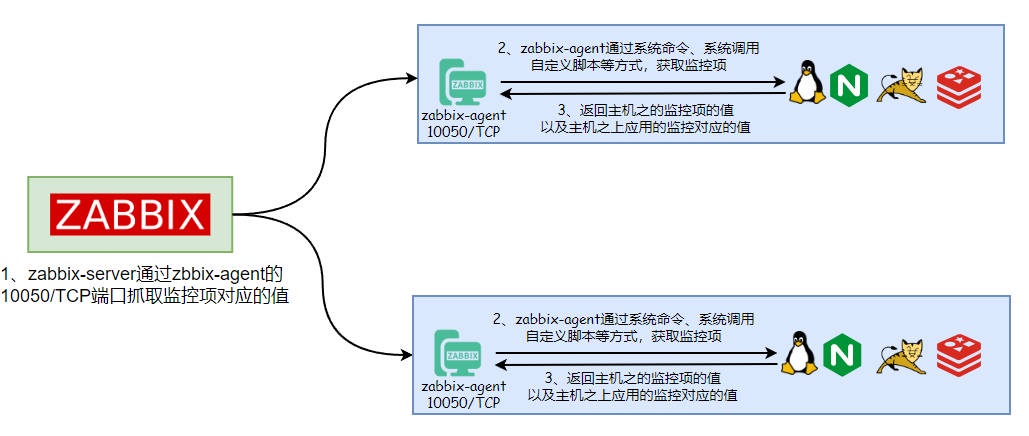
在传统的 Zabbix 监控系统中,通常是需要在被监控的节点上安装 Agent 代理程序。由 Agent 代理程序定期收集指标数据,并将其发送到监控服务器,完成数据采集。
在 Prometheus 中,被监控端⽆需安装专⻔的 Agent。它只需要 “被监控端通过 HTTP 协议开放出符合 Prometheus 规范的指标数据”,Prometheus 就能够顺利完成数据抓取。
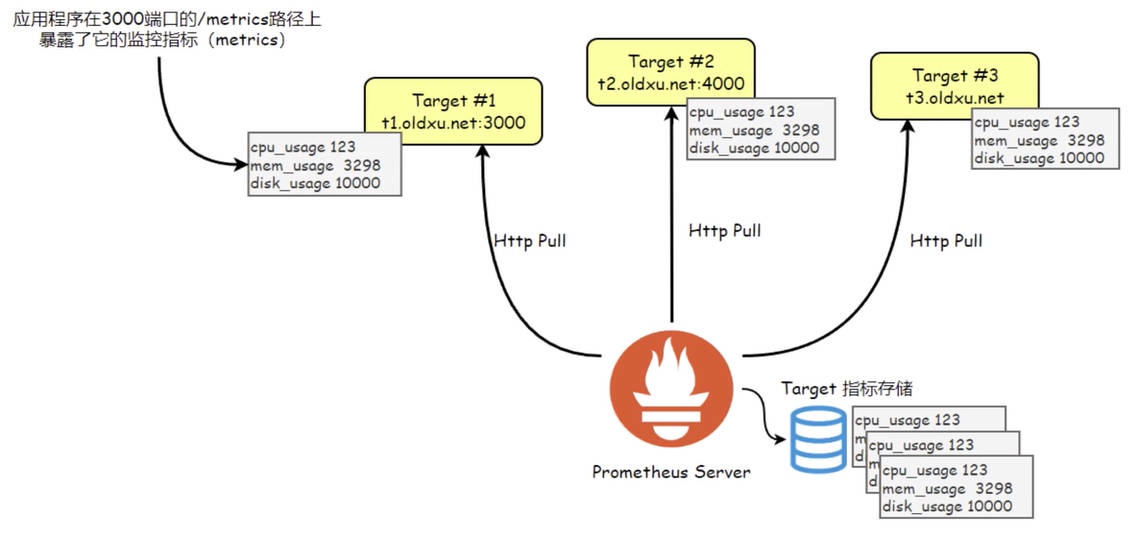
但,并不是所有的应⽤或服务都能直接⽀持 HTTP 协议并提供符合 Prometheus 所兼容的指标格式。因此,Prometheus 设计了三种主要的数据抓取机制,即 Instrumentation、Exporter 和 PushGateway。
- Instrumentation :被监控端通过 HTTP 暴露出 Prometheus 格式的数据,Prometheus 就可以直接采集,这就是所谓的 Instrumentation。像 Kubernetes、Haproxy、Zookeeper、RabbitMQ、Etcd 等应⽤程序原⽣就⽀持暴露指标,可以直接被 Prometheus 所监控。对于 Python、Java、Go 这些开发语⾔编写的业务应⽤,开发⼈员可以直接引⽤ Prometheus 客户端库来编写代码,让应⽤程序原⽣就能⽀持暴露需要监控的指标数据,这些指标数据可以直接被 Prometheus 采集。这就相当于应⽤程序本身具备了与 Prometheus 通信的能⼒,⽆需额外的中间件来转换数据。
- Exporter(导出器) :有些应⽤程序并不原⽣⽀持通过 HTTP 协议暴露指标数据。对于这类应⽤,我们可以使⽤ Exporter 来代为采集指标。Exporter 是⼀个独⽴的运⾏程序,负责从⽬标应⽤中采集原始格式的数据,并将其转换为 Prometheus 可以理解的格式,然后通过 HTTP 协议暴露出来,供 Prometheus 抓取指标。简单来说,Exporter 就像⼀个翻译官,将⽬标应⽤程序的数据翻译成 Prometheus 可以读懂的语⾔。
- PushGateway(推送⽹关) :对于那些⽣命周期较短或者不⽅便被 Prometheus 主动拉取数据的应⽤程序(如短暂运⾏的脚本任务)可以使⽤ PushGateway。让这些短暂运⾏的脚本程序,将对应的指标数据主动推送到 PushGateway,然后 Prometheus 从 PushGateway 中抓取这些数据。PushGateway 就像⼀个中间站,存储这些短暂任务产⽣的指标数据,等待 Prometheus 来抓取。
# 1.5 Prometheus 作业与实例
在 Prometheus 中,被监控的每⼀个对象都称为实例(Instance) 实例代表着⼀个独⽴的监控⽬标,它由 IP 地址加端⼝号组合⽽成,
如 localhost:9090 。在 Prometheus 的配置中,这些实例也可以被称为” ⽬标(Target)“或者 “端点(Endpoint)”。
为了⽅便管理这些⽬标实例,我们通常会将功能相似或者类型相同的(实例 Instance)归纳到⼀个 “作业(Job)” 中。
- 实例(Instances):实例指的是⼀个被监控的端点。它通常是指向⼀个运⾏的服务或应⽤程序的进程,每个实例都以 host:port 进⾏标识。例如,⼀个 MySQL 数据库服务运⾏在 10.0.0.51:3306 上,那么它就是⼀个实例。
- 作业(Jobs):作业是⼀组具有相同类型的实例集合。例如,多个分布在不同服务器上 MySQL 应⽤,你可以将这些实例归类为同⼀个 mysql 的 Job 作业,⽽后按照 Job 分组后的维度进⾏分析。
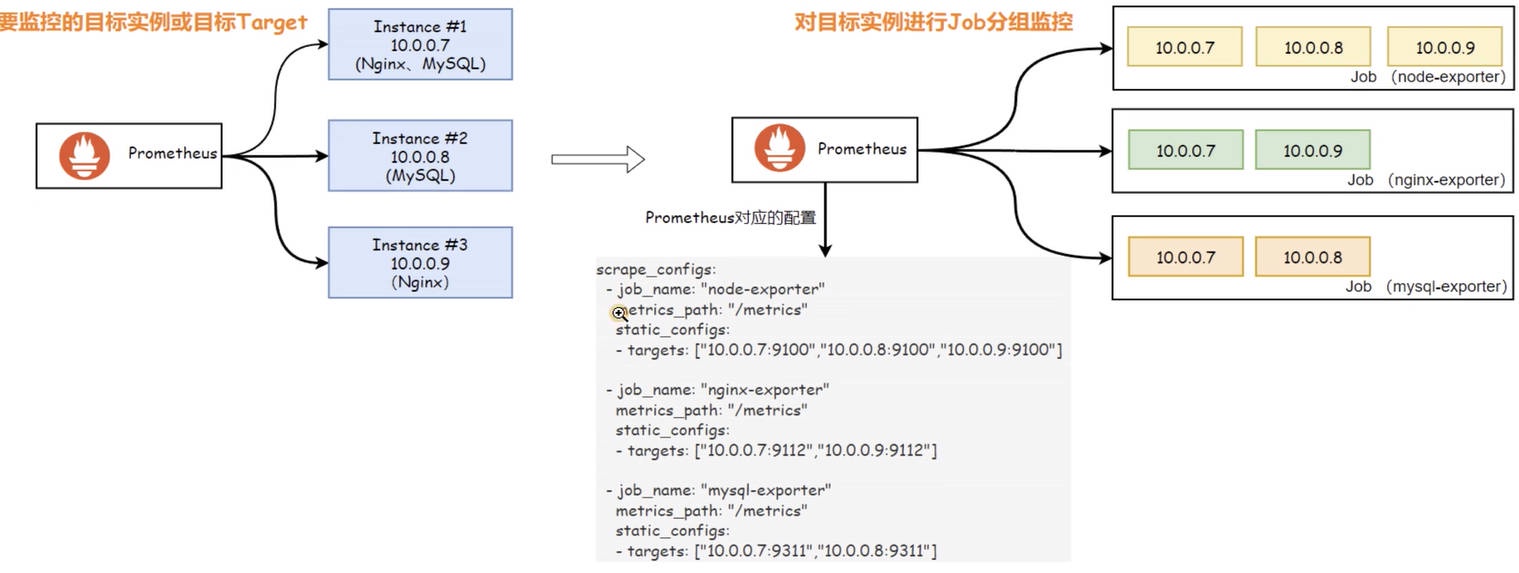
在 Prometheus 的数据模型中,job 和 instance 是两个核⼼的标签,它们会⾃动附加到所有收集的时间序列数据上。如下所示:
# 查询 | |
cpu_usage | |
# 结果 | |
cpu_usage{job="node-exporter",instance="10.0.0.7"} 14.04 | |
cpu_usage{job="node-exporter",instance="10.0.0.8"} 12.04 | |
cpu_usage{job="node-exporter",instance="10.0.0.9"} 16.04 |
# 1.6 Prometheus 架构
Prometheus 最为核⼼的功能就是 “数据采集” 和 “数据存储”。但是,仅有这两项功能并不能构成⼀个完整的监控系统。因此,Prometheus 需要与其他的组件进⾏结合,从⽽实现数据的分析、展示和告警,因此⼀个完整意义上的监控系统⼤体需要如下 5 个组成部分:
- 1、数据采集:Prometheus 采⽤ Pull 模式主动向被监控端抓取指标数据。被监控端可以是直接暴露出的应⽤程序指标数据,也可以是通过安装 Exporter 来抓取和暴露应⽤程序的数据。只要是以 Prometheus 格式提供的指标数据,都可以被 Prometheus 抓取。
- 2、数据存储:Prometheus 会将抓取到的数据,存储在本地的时间序列数据库中,以防⽌数据丢失。
- 3、数据查询和分析:Prometheus 内置了强⼤的查询语⾔ PromQL,⽤户可以通过 PromQL 查询存储在 Prometheus 上的时序数据,进⾏实时查询和分析。同时 PromQL ⽀持多种聚合操作和数学运算,可以对数据进⾏深⼊分析。
- 4、告警系统:Prometheus 的告警分为了两个部分组成,告警规则和 Alertmanager。告警规则定义在 Prometheus 服务器中,根据⽤户指定的条件触发告警。当告警触发时,Prometheus 服务器会将告警信息发送给 Alertmanager。Alertmanager 会对告警信息进⾏去重、分组,然后将告警消息通过媒介发送给接收者(如邮件、钉钉等)。
- 5、数据可视化:Prometheus 内置了⼀个简单的图形界⾯,⽤户可以在 Web 浏览器中使⽤ PromQL 查询时序数据,并将查询结果以图形的形式展示出来。此外,Prometheus 还可以与第三⽅可视化⼯具(如 Grafana)集成,提供更丰富的可视化功能。
了解 Prometheus ⽣态中的各个组件后,我们可以概括其⼯作流程:⽬标发现、数据抓取、存储、分析、告警和展示。这些步骤共同构成了 Prometheus 强⼤的监控和告警系统。
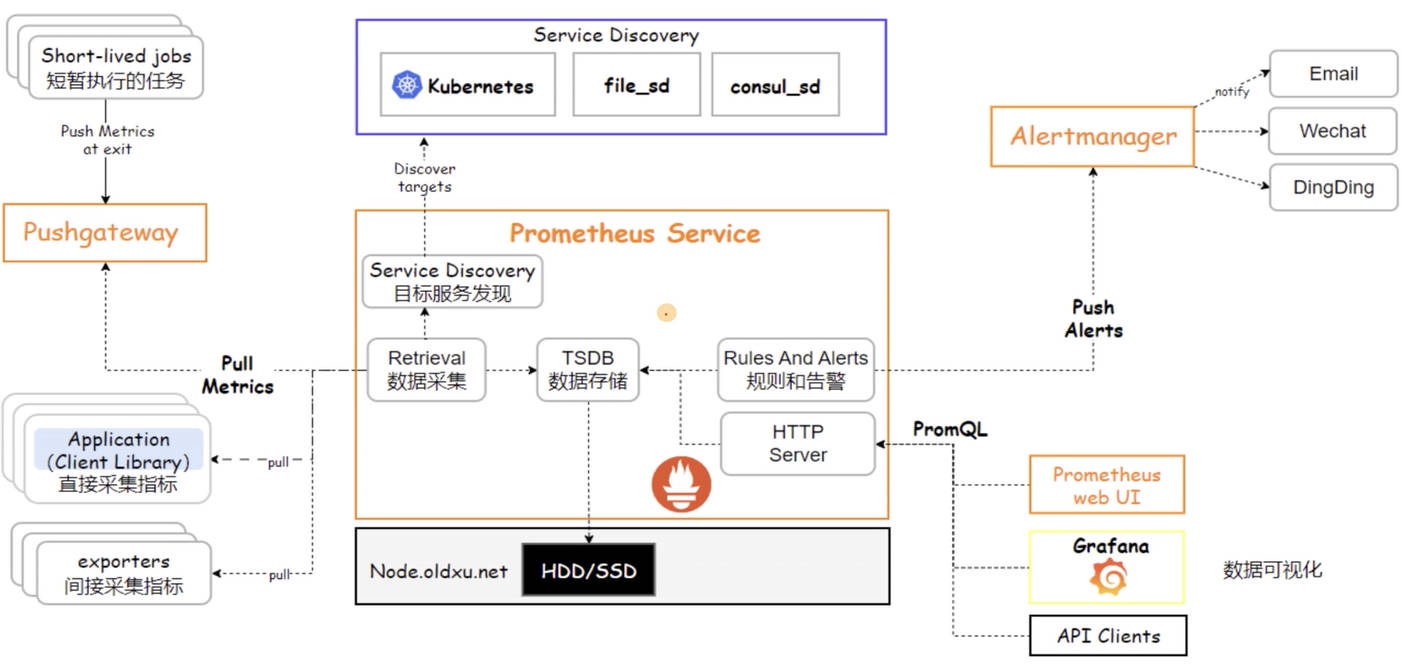
- 1、⽬标发现:在开始监控之前,Prometheus 需要确定监控⽬标。它可以通过静态的配置⽂件指定,或者利⽤服务发现机制动态地发现需要监控的服务。例如,在 Kubernetes 环境中,Prometheus 能够⾃动识别并监控集群中的服务,确保随着集群的变化,监控⽬标始终是最新的。
- 2、数据抓取:有了明确的监控⽬标后,Prometheus 通过 HTTP 协议定期从这些⽬标的 /metrics 端点抓取指标数据。这些端点暴露了各种监控指标。
- 3、数据存储:数据抓取后会存储在本地的时间序列数据库中。
- 4、数据分析:数据⼀旦被存储,就可以⽤ PromQL 查询语⾔,对其进⾏分析。⽆论是实时监控还是历史数据分析,PromQL 都能提供丰富的数据聚合功能,以洞察系统的状况。
- 5、告警:Prometheus 根据预定义的规则进⾏评估。当监控的指标达到告警阈值时,Prometheus 会将告警信息发送给 Alertmanager,由 Alertmanager 进⾏告警处理并通知。
- 6、数据可视化:Prometheus ⾃带了简单的 UI。但对于更⾼级的数据可视化需求,通常会整合 Grafana 这样的⼯具来为⽤户提供直观的数据展现⽅式。
# 1.7 Prometheus 数据模型
Prometheus 中最为重要的是,对指标进⾏抓取和存储,这些存储下来的数据可以帮助我们分析趋势,或预测未来。为了更有⾼效的存储和查询这些数据,Prometheus 使⽤了⼀种叫 "时间序列" 的数据格式进⾏存储,所谓时间序列就是按照时间顺序记录所采集到的指标以及指标数据。⽽每个时间序列都是由 “⼀个指标名称加⼀堆标签” 所组成的⼀条唯⼀序列标识,其格式 "<metric_name>{<label_name>=<label_value>, <label_name>=<label_value>, ...} @
# 查询 node01 节点的各 CPU 核⼼使⽤率 | |
cpu_usage{instance="node01.oldxu.net"} | |
# 结果 | |
cpu_usage{instance="node01.oldxu.net",core="0"} 7.535 | |
cpu_usage{instance="node01.oldxu.net",core="1"} 7.535 | |
# 查询 node02 节点,核⼼为 0 的 CPU 使⽤率 | |
cpu_usage{instance="node02.oldxu.net",core="0"} | |
# 结果 | |
cpu_usage{instance="node01.oldxu.net",core="0"} 8.025 |
# 二、Prometheus 安装
Prometheus 支持多种安装方式,为了便于理解,我们先使用二进制方式进行部署,后期在使用 Kubernetes 方式进行部署。
# 2.1 环境准备
| IP 地址 | 主机名名称 | 系统版本 | 内核版本 | CPU | 内存 |
|---|---|---|---|---|---|
| 192.168.40.221 | prom-node01.oldxu.net | Centos7.9 | 3.10.0-957.el7.x86_64 | 2Core | 2G |
| 192.168.40.222 | prom-node02.oldxu.net | Centos7.9 | 3.10.0-957.el7.x86_64 | 2Core | 2G |
| 192.168.40.223 | prom-node03.oldxu.net | Centos7.9 | 3.10.0-957.el7.x86_64 | 2Core | 2G |
| 192.168.40.224 | prom-node04.oldxu.net | Centos7.9 | 3.10.0-957.el7.x86_64 | 2Core | 2G |
| 192.168.40.225 | prom-node05.oldxu.net | Centos7.9 | 3.10.0-957.el7.x86_64 | 2Core | 2G |
# 2.2 配置 Host 解析
1、配置 hosts 解析
echo "192.168.40.221 prom-node01.oldxu.net" >> /etc/hosts | |
echo "192.168.40.222 prom-node02.oldxu.net" >> /etc/hosts | |
echo "192.168.40.223 prom-node03.oldxu.net" >> /etc/hosts | |
echo "192.168.40.224 prom-node04.oldxu.net" >> /etc/hosts | |
echo "192.168.40.225 prom-node05.oldxu.net" >> /etc/hosts |
2、推送 hosts 解析文件,确保每个节点都能正常通过主机名进行访问
for i in {222..225} | |
do | |
scp /etc/hosts root@192.168.40.$i:/etc/hosts | |
done |
# 2.3 下载 Prometheus
1、访问 Prometheus 官网 https://prometheus.io/download/下载 Prometheus
[root@prom-node01 ~]# wget https://github.com/prometheus/prometheus/releases/download/v2.49.1/prometheus-2.49.1.linux-amd64.tar.gz | |
# 加速地址 | |
[root@prom-node01 ~]# wget https://mirror.ghproxy.com/https://github.com/prometheus/prometheus/releases/download/v2.49.1/prometheus-2.49.1.linux-amd64.tar.gz |
2、解压 Prometheus 至指定目录
[root@prom-node01 ~]# tar xf prometheus-2.49.1.linux-amd64.tar.gz -C /etc | |
[root@prom-node01 ~]# ln -s /etc/prometheus-2.49.1.linux-amd64/ /etc/prometheus |
3、执行 prometheus --version 查看命令是否正常
[root@prom-node01 ~]# /etc/prometheus/prometheus --version | |
prometheus, version 2.49.1 (branch: HEAD, revision: 43e14844a33b65e2a396e3944272af8b3a494071) | |
build user: root@6d5f4c649d25 | |
build date: 20240115-16:58:43 | |
go version: go1.21.6 | |
platform: linux/amd64 | |
tags: netgo,builtinassets,stringlabels |
# 2.4 配置 Prometheus
1、在启动 Prometheus 之前,我们需要准备一个 Prometheus 的配置文件,监控目标服务。由于 Prometheus 服务本身对外暴露了 Metrics 指标接口,所以我们可以配置 Prometheus 监控自身,保存一个名为 prometheus.yml 的文件,替换掉默认的配置文件
[root@prom-node01 ~]# cp /etc/prometheus/prometheus.yml /etc/prometheus/prometheus.yml_bak | |
[root@prom-node01 ~]# cat /etc/prometheus/prometheus.yml | |
# 全局段定义 | |
global: | |
scrape_interval: 15s # 设置 Prometheus 抓取指标数据的间隔,默认为 15 秒。 | |
# 抓取指定的目标 | |
scrape_configs: | |
- job_name: "prometheus" # 定义一个抓取任务,名为 'prometheus'。 | |
metrics_path: "/metrics" # 指定 Prometheus 从监控目标暴露的 HTTP 端点路径抓取指标,默认为 '/metrics'。 | |
static_configs: # 配置静态目标地址,Prometheus 将定期从如下这些地址抓取指标。 | |
- targets: ["prom-node01.oldxu.net:9090"] |
2、启动可以直接通过命令启动,但直接这么启动不是很方便,因此我们可以准备一个专属的启动文件
[root@prom-node01 ~]# /etc/prometheus/prometheus --config.file=/etc/prometheus/prometheus.yml |
# 2.5 启动 Prometheus
1、配置 system 管理 Prometheus 启动和停止
[root@prom-node01 ~]# cat /usr/lib/systemd/system/prometheus.service | |
[Unit] | |
Description=Prometheus server | |
Documentation=https://prometheus.io/ | |
[Service] | |
User=root | |
Restart=always | |
ExecStart=/etc/prometheus/prometheus \ | |
--config.file=/etc/prometheus/prometheus.yml \ | |
--storage.tsdb.path=/etc/prometheus/data \ | |
--storage.tsdb.retention.time=60d \ | |
--web.enable-lifecycle | |
ExecReload=/bin/kill -HUP $MAINPID | |
Restart=on-failure | |
RestartSec=20 | |
TimeoutStopSec=20 | |
SendSIGKILL=no | |
LimitNOFILE=8192 | |
[Install] | |
WantedBy=multi-user.target |
2、在启动 Prometheus 服务时通过参数传递了一些配置选项,它们定义了 Prometheus 服务的一些关键行为。
--config.file=/etc/prometheus/prometheus.yml # 指定 Prometheus 的配置文件路径。 | |
--storage.tsdb.path=/etc/prometheus/data # 设置 Prometheus 存储时间序列数据库(TSDB)的路径。用于存放 Prometheus 抓取到的指标数据。 | |
--storage.tsdb.retention.time=60d # 配置 Prometheus 的数据保留期限。超过这个时间范围的旧数据将被删除。这个可以根据存储资源和监控需求进行调整。 | |
--web.enable-lifecycle # 允许通过 HTTP 请求的方式来更新 Prometheus 的配置。 |
3、启动 Prometheus 服务
[root@prom-node01 ~]# systemctl daemon-reload | |
[root@prom-node01 ~]# systemctl start prometheus | |
[root@prom-node01 ~]# netstat -lntp |grep 9090 | |
tcp6 0 0 :::9090 :::* LISTEN 2057/prometheus | |
#通过 HTTP 请求的方式来热更新 Prometheus 的配置文件 | |
[root@prom-node01 ~]# curl -X POST http://localhost:9090/-/reload |
# 2.6 访问 Prometheus
1、通过访问对应服务的 IP:9090 端口,访问 Prometheus 的 UI 界面
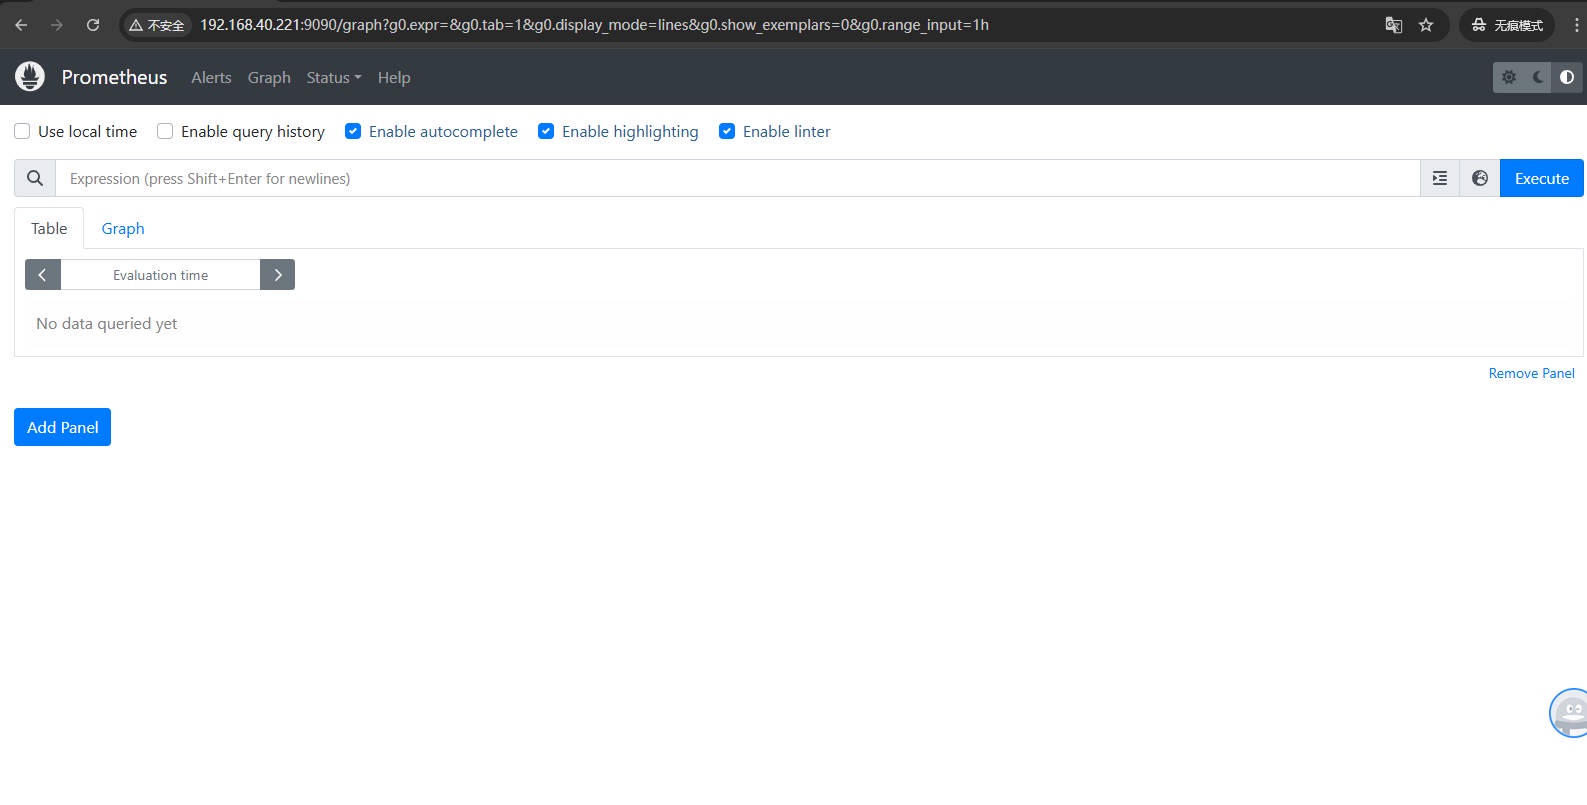
# 2.7 Prometheus 的 WebUI
Prometheus 的 Web UI 提供了多个页面,以便用户可以查询指标、查看配置和状态,以及管理告警等。以下是 Prometheus Web UI 中常见的几个页面及其描述:
Graph: 允许用户通过 Prometheus 的查询语言 PromQL 来查询数据,并将结果以图形的形式展示。
Alerts:允许用户查看当前配置的告警规则以及每个告警的状态。
Status:页面包含了几个子页面,它们提供了关于 Prometheus 服务器本身的各种信息:
Command-Line Flags: 显示了 Prometheus 启动时使用的命令行参数。这有助于了解 Prometheus 的配置和运行状态。
Configuration: 展示了 Prometheus 当前加载的配置文件内容,可以用来确认 Prometheus 正在使用的配置,有助于调试问题。
Targets: 显示了 Prometheus 监控的采集目标列表,包括每个目标的健康状态。如果某个目标无法抓取,这里也会显示相关的错误信息。
Rules: 显示所有配置的告警和记录规则。
Service Discovery: 展示了 Prometheus 的服务发现状态,这包括了 Prometheus 如何发现抓取目标,以及它们的当前状态和元数据信息。
# 三、安装 Grafana 图形展示
# 3.1 Grafana 介绍
Grafana 是一款开源的数据分析和可视化工具,从 2.5.0 版本开始,Grafana 已经内置了对 Prometheus 的支持,可以直接将 Prometheus 作为数据源进行查询和展示。
# 3.2 Grafana 安装
1、访问 Grafana 官网 https://grafana.com/grafana/download,下载 Grafana
[root@prom-node01 ~]# wget https://dl.grafana.com/enterprise/release/grafana-enterprise-10.3.1-1.x86_64.rpm |
2、安装并启动 Grafana
[root@prom-node01 ~]# yum localinstall grafana-enterprise-10.3.1-1.x86_64.rpm -y | |
[root@prom-node01 ~]# systemctl start grafana-server && systemctl enable grafana-server | |
[root@prom-node01 ~]# netstat -lntp |grep 3000 | |
tcp6 0 0 :::3000 :::* LISTEN 1787/grafana |
3、访问 Grafana,通过http://IP:3000,默认 Grafana 用户名为admin,密码为admin
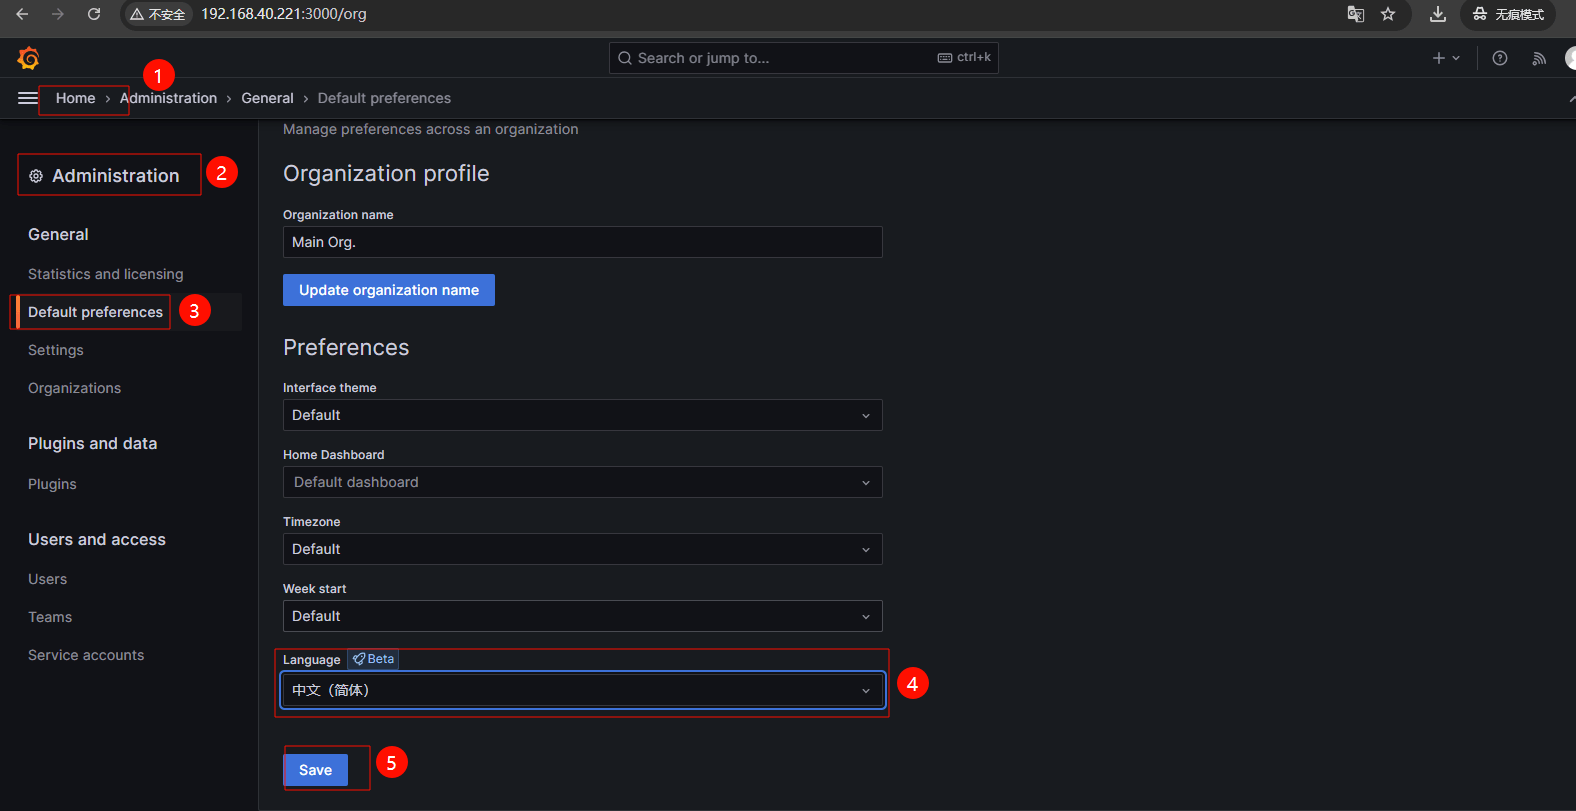
4、点击左边菜单选择Administration-->Default Preferences(偏好设置)在Language选项中选择简体中文然后Save.
# 3.3 配置 Grafana 数据源
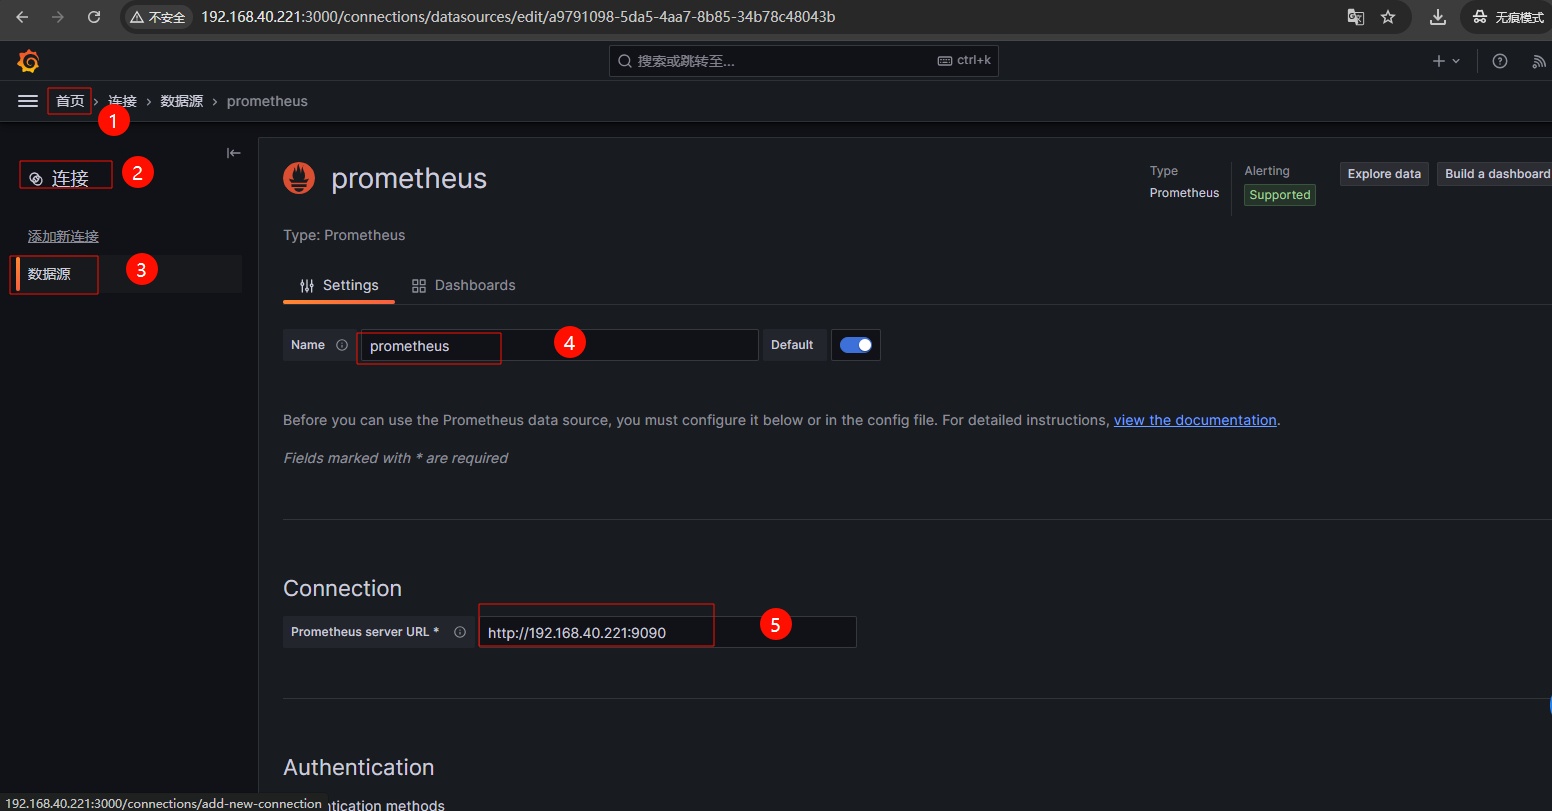
1、配置 Grafana 数据源为 Prometheus,点击菜单,选择Connections-->Data sources--> 选择 Prometheus
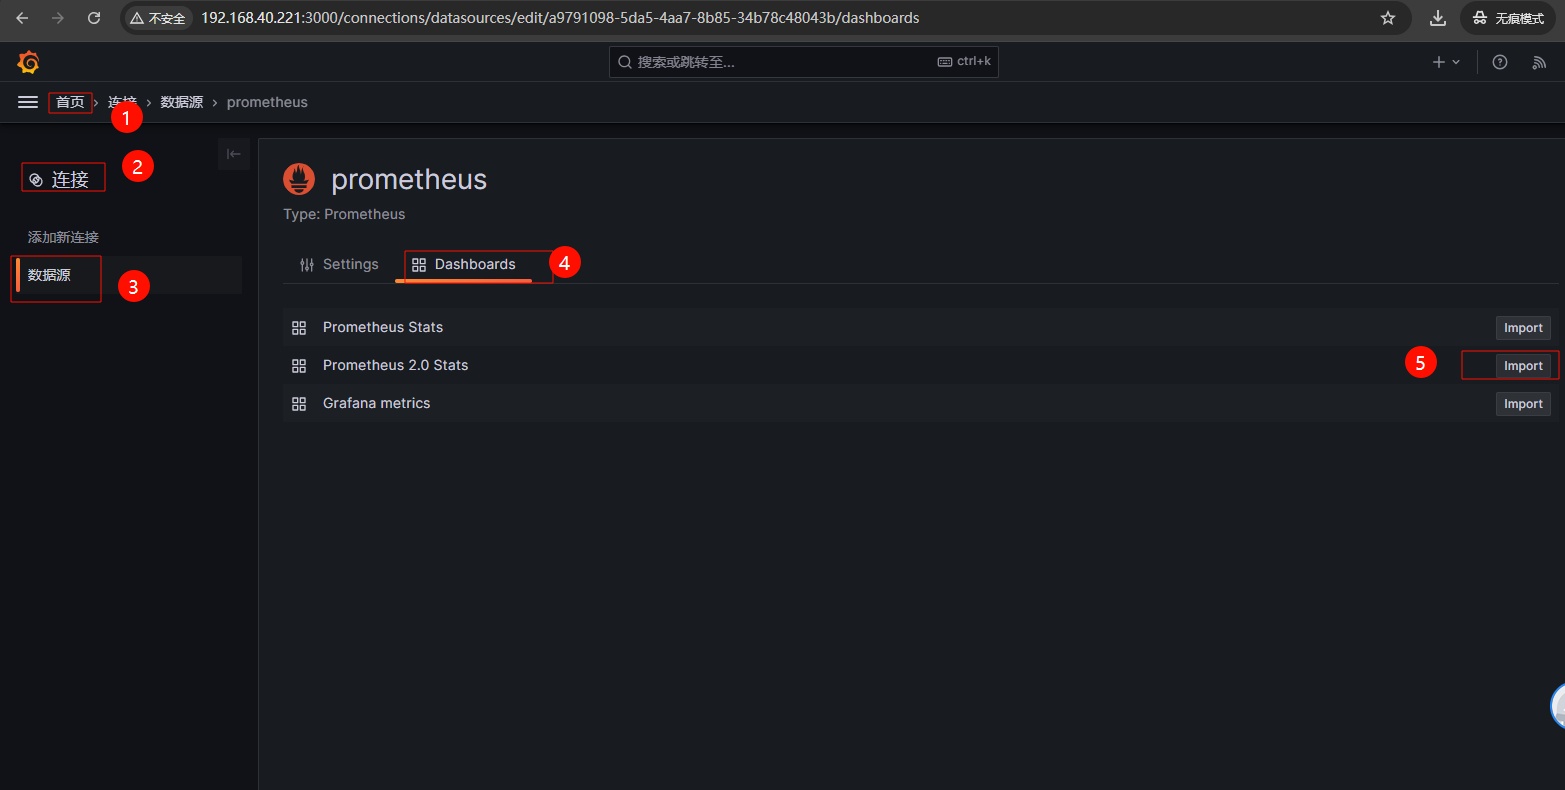
2、导入 Grafana 默认监控 Prometheus 的 Dashboards,该 Dashboard 主要用于监控 Prometheus 服务器本身的性能和状态指标。
3、通过图形界面展示 Prometheus 的数据指标;
# 3.4 配置 Prometheus 监控 Grafana
Grafana 作为一个广泛使用的可视化工具,其实也需要被监控。幸运的是 Grafana 本身提供了一个内置的指标端点。通过访问 http://<grafana-ip:3000/metrics,你可以获取到 Grafana 的性能指标。这些指标包括了 HTTP 请求统计、内存使用情况、图形的数量,活跃用户数等指标,它们对于监控 Grafana 的健康状况非常有帮助。
1、访问 Grafana 对外暴露指标的 Metrics 接口,如果没有问题,会看到一系列的指标数据
[root@prom-node01 ~]# curl -s http://prom-node01.oldxu.net:3000/metrics| tail -10 | |
# TYPE prometheus_template_text_expansions_total counter | |
prometheus_template_text_expansions_total 0 | |
# HELP promhttp_metric_handler_requests_in_flight Current number of scrapes being served. | |
# TYPE promhttp_metric_handler_requests_in_flight gauge | |
promhttp_metric_handler_requests_in_flight 0 | |
# HELP promhttp_metric_handler_requests_total Total number of scrapes by HTTP status code. | |
# TYPE promhttp_metric_handler_requests_total counter | |
promhttp_metric_handler_requests_total{code="200"} 0 | |
promhttp_metric_handler_requests_total{code="500"} 0 | |
promhttp_metric_handler_requests_total{code="503"} 0 |
2、配置 Prometheus,将 Grafana 作为一个监控目标(target)添加到配置中。
[root@prom-node01 ~]# cat /etc/prometheus/prometheus.yml | |
# 全局段定义 | |
global: | |
scrape_interval: 15s # 设置 Prometheus 抓取指标数据的间隔,默认为 15 秒。 | |
# 抓取指定的目标 | |
scrape_configs: | |
- job_name: "prometheus" # 定义一个抓取任务,名为 'prometheus'。 | |
metrics_path: "/metrics" # 指定 Prometheus 从监控目标暴露的 HTTP 端点路径抓取指标,默认为 '/metrics'。 | |
static_configs: # 配置静态目标地址,Prometheus 将定期从如下这些地址抓取指标。 | |
- targets: ["prom-node01.oldxu.net:9090"] | |
- job_name: "grafana" | |
metrics_path: "/metrics" | |
static_configs: | |
- targets: ["prom-node01.oldxu.net:3000"] | |
[root@prom-node01 ~]# /etc/prometheus/promtool check config /etc/prometheus/prometheus.yml | |
Checking /etc/prometheus/prometheus.yml | |
SUCCESS: /etc/prometheus/prometheus.yml is valid prometheus config file syntax | |
[root@prom-node01 ~]# curl -X POST http://localhost:9090/-/reload |
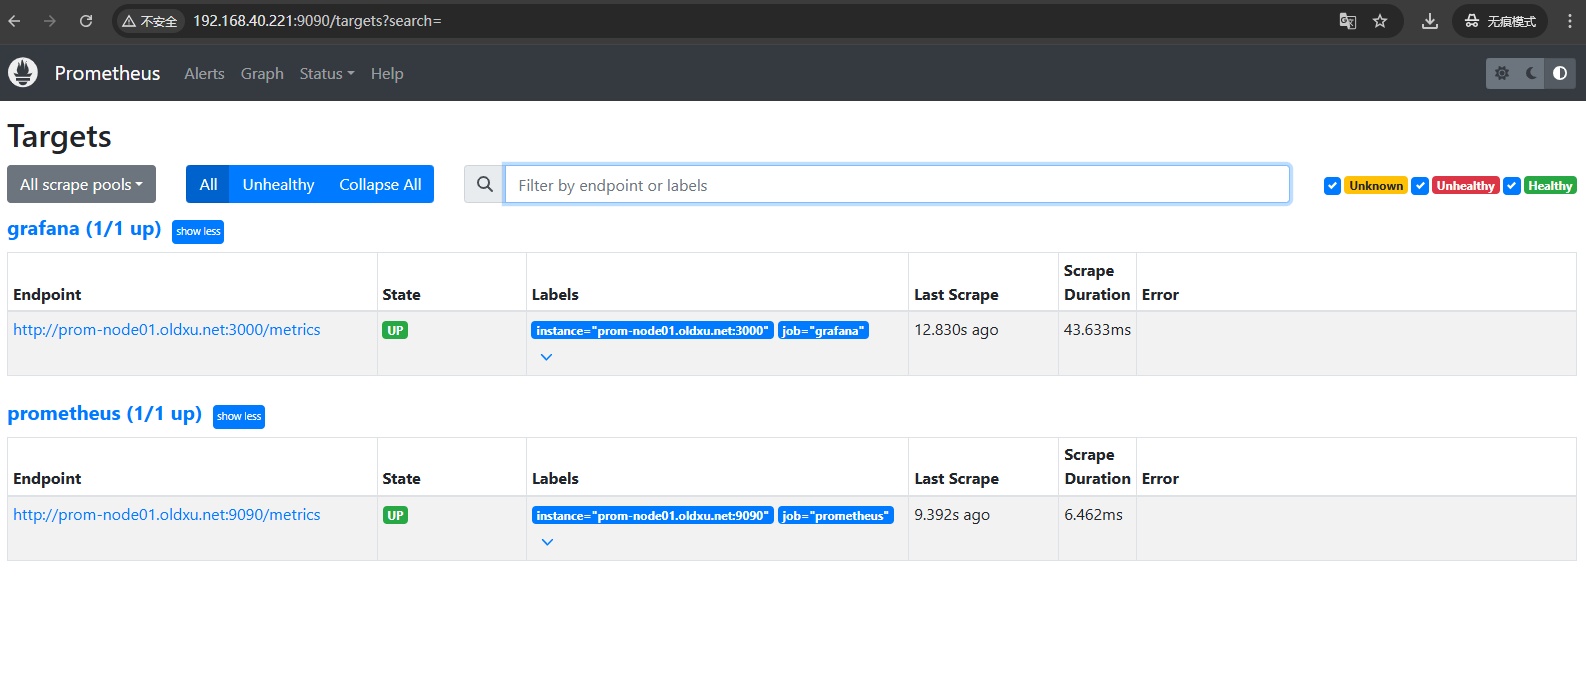
3、访问 Prometheus,在 Status 中的 Targets 页面,能看到新添加的 grafana 目标;如果 State 显示 UP,说明 Prometheus 正在从 Grafana 抓取指标。
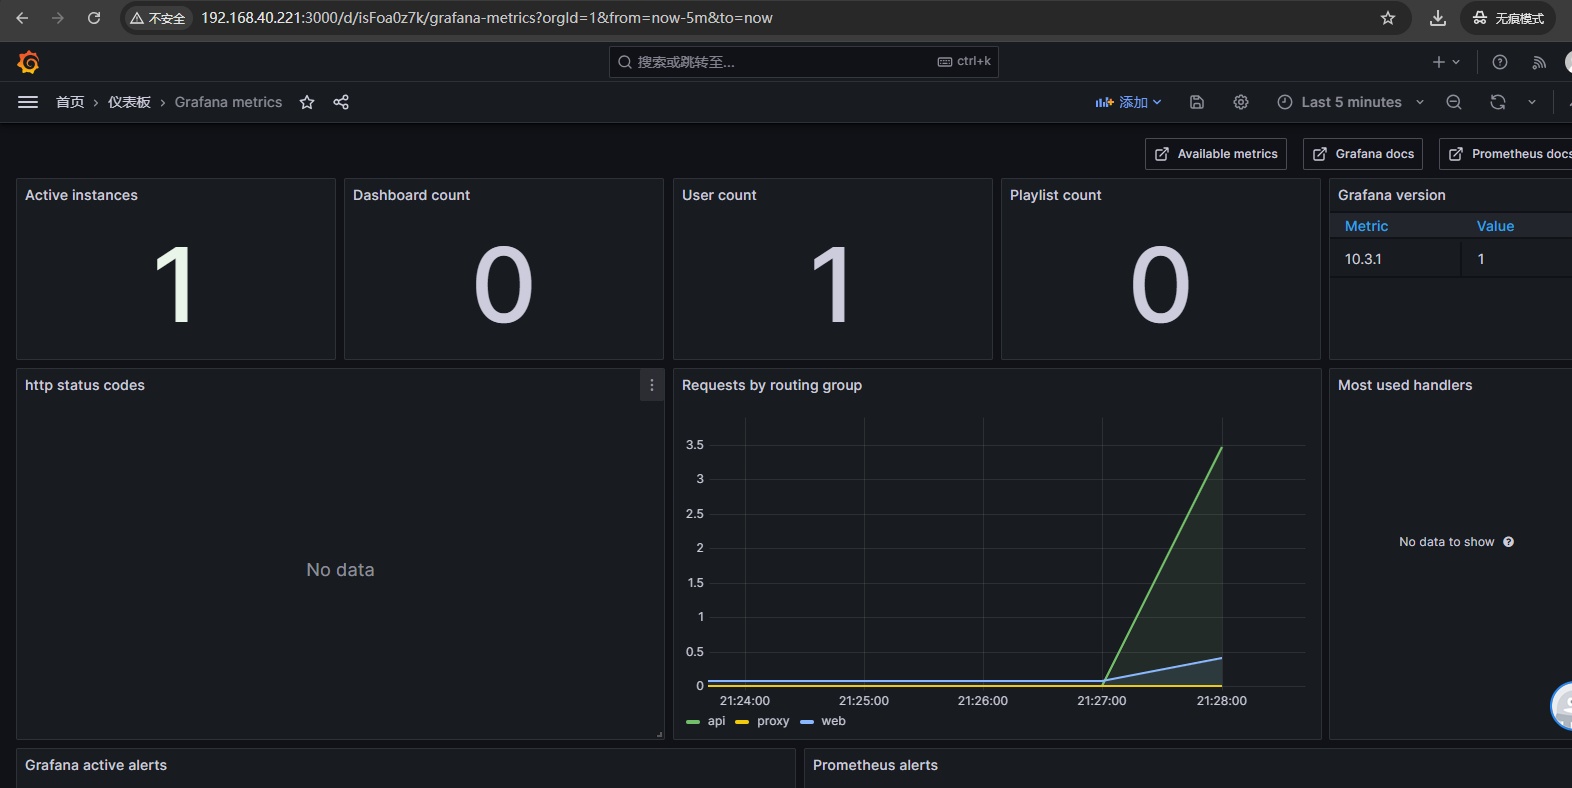
4、接下来可以在 Grafana 中创建一个(Dashboard),也可以使用之前配置 Prometheus 导入的 Grafana 模板,这样就可以直观地展示被监控的 Grafana 服务状态;
# 四、配置 Prometheus 监控 Node 节点
# 4.1 如何监控 Node 节点
监控节点(如服务器或者虚拟机)通常涉及收集硬件和操作系统层面的指标,比如 CPU 使用率、内存占用、磁盘 I/O、网络流量等。但是这些指标并不能直接被 Prometheus 抓取,因此我们需要借助 Node exporter 将对应的指标转为 Prometheus 能够兼容的指标格式,并对外提供 HTTP 接口暴露给 Prometheus 进行指标抓取。
监控地址规划:
| IP 地址 | 主机名名称 | 系统版本 | 内核版本 | CPU | 内存 |
|---|---|---|---|---|---|
| 192.168.40.221 | prom-node01.oldxu.net | Centos7.9 | 3.10.0-957.el7.x86_64 | 2Core | 2G |
| 192.168.40.222 | prom-node02.oldxu.net | Centos7.9 | 3.10.0-957.el7.x86_64 | 2Core | 2G |
| 192.168.40.223 | prom-node03.oldxu.net | Centos7.9 | 3.10.0-957.el7.x86_64 | 2Core | 2G |
# 4.2 安装 node_exporter
1、访问 Node-exporter 的 github,获取 Node-exporter 的下载地址, https://github.com/prometheus/node_exporter/releases/
[root@prom-node01 ~]# wget https://github.com/prometheus/node_exporter/releases/download/v1.7.0/node_exporter-1.7.0.linux-amd64.tar.gz | |
# 加速地址 | |
[root@prom-node01 ~]# wget https://mirror.ghproxy.com/https://github.com/prometheus/node_exporter/releases/download/v1.7.0/node_exporter-1.7.0.linux-amd64.tar.gz | |
# 推送给其他节点 | |
for i in {222..225} | |
do | |
scp node_exporter-1.7.0.linux-amd64.tar.gz root@192.168.40.$i:~ | |
done |
2、解压 node-exporter
[root@prom-node01 ~]# tar xf node_exporter-1.7.0.linux-amd64.tar.gz -C /etc | |
[root@prom-node01 ~]# ln -s /etc/node_exporter-1.7.0.linux-amd64/ /etc/node_exporter | |
[root@prom-node01 ~]# ll /etc/node_exporter/ | |
total 19476 | |
-rw-r--r-- 1 1001 1002 11357 Nov 13 08:02 LICENSE | |
-rwxr-xr-x 1 1001 1002 19925095 Nov 13 07:54 node_exporter | |
-rw-r--r-- 1 1001 1002 463 Nov 13 08:02 NOTICE |
# 4.3 配置 node_exporter
启动 Node Exporter 即可开始进行指标采集,它默认启用了一些常见的收集器以监控 CPU、内存、网络等关键指标。然而,由于每个操作系统对收集器的支持程度不同,Node Exporter 也提供了一些 "默认未启用的收集器"。我们可以根据监控需求,通过特定的参数来启用这些收集器。
- 要禁用默认激活的收集器,可以使用参数 --no-collector.
- 要启用默认未激活的收集器,可以使用参数--collector.
如果只想启动某些特定的收集器,可以使用 --collector.disable-defaults标志禁用所有默认的,然后在指定具体要启用收集器 --collector.<name 来进行收集。
默认关闭一些收集器的原因在于,有些指标采集需要占用过多资源开销、太重、太慢;所以谨慎开启;
1、例如,禁止默认启动的 arp 的采集
# 直接启动会发现有 arp 采集 | |
[root@prom-node01 ~]# /etc/node_exporter/node_exporter | |
... | |
ts=2024-02-22T13:21:35.150Z caller=node_exporter.go:117 level=info collector=arp | |
# 禁用 arp 收集器,就看不到了 | |
[root@prom-node01 ~]# /etc/node_exporter/node_exporter --no-collector.arp |
2、启用默认未激活的tcpstat收集器
[root@prom-node01 ~]# /etc/node_exporter/node_exporter | |
[root@prom-node01 ~]# /etc/node_exporter/node_exporter --collector.tcpstat | |
... | |
ts=2024-02-22T13:23:34.296Z caller=node_exporter.go:117 level=info collector=tcpstat |
3、也可以禁用所有收集器,仅启用那些只想启用的收集器
[root@prom-node01 ~]# /etc/node_exporter/node_exporter --collector.disable-defaults --collector.cpu --collector.meminfo --collector.diskstats --collector.netstat | |
ts=2024-02-22T13:25:37.969Z caller=node_exporter.go:192 level=info msg="Starting node_exporter" version="(version=1.7.0, branch=HEAD, revision=7333465abf9efba81876303bb57e6fadb946041b)" | |
ts=2024-02-22T13:25:37.969Z caller=node_exporter.go:193 level=info msg="Build context" build_context="(go=go1.21.4, platform=linux/amd64, user=root@35918982f6d8, date=20231112-23:53:35, tags=netgo osusergo static_build)" | |
ts=2024-02-22T13:25:37.969Z caller=node_exporter.go:195 level=warn msg="Node Exporter is running as root user. This exporter is designed to run as unprivileged user, root is not required." | |
ts=2024-02-22T13:25:37.970Z caller=diskstats_common.go:111 level=info collector=diskstats msg="Parsed flag --collector.diskstats.device-exclude" flag=^(ram|loop|fd|(h|s|v|xv)d[a-z]|nvme\d+n\d+p)\d+$ | |
ts=2024-02-22T13:25:37.970Z caller=node_exporter.go:110 level=info msg="Enabled collectors" | |
ts=2024-02-22T13:25:37.970Z caller=node_exporter.go:117 level=info collector=cpu | |
ts=2024-02-22T13:25:37.970Z caller=node_exporter.go:117 level=info collector=diskstats | |
ts=2024-02-22T13:25:37.970Z caller=node_exporter.go:117 level=info collector=meminfo | |
ts=2024-02-22T13:25:37.970Z caller=node_exporter.go:117 level=info collector=netstat | |
ts=2024-02-22T13:25:37.970Z caller=tls_config.go:274 level=info msg="Listening on" address=[::]:9100 | |
ts=2024-02-22T13:25:37.970Z caller=tls_config.go:277 level=info msg="TLS is disabled." http2=false address=[::]:9100 |
# 4.4 启动 node_exporter
1、配置 system 管理 Prometheus 启动和停止
[root@prom-node01 ~]# cat /usr/lib/systemd/system/node_exporter.service | |
[Unit] | |
Description=node_exporter | |
Documentation=https://prometheus.io/ | |
After=network.target | |
[Service] | |
ExecStart=/etc/node_exporter/node_exporter \ | |
--web.listen-address=:9100 \ | |
--web.max-requests=40 \ | |
--collector.mountstats \ | |
--collector.systemd \ | |
--collector.ethtool \ | |
--collector.tcpstat | |
ExecReload=/bin/kill -HUP | |
TimeoutStopSec=20s | |
Restart=always | |
[Install] | |
WantedBy=multi-user.target |
2、启动 node-exporter
[root@prom-node01 ~]# systemctl daemon-reload | |
[root@prom-node01 ~]# systemctl start node_exporter | |
[root@prom-node01 ~]# netstat -lntp|grep 9100 | |
tcp6 0 0 :::9100 :::* LISTEN 6340/node_exporter |
3、访问对应的 metrics,验证是否能采集到数据
[root@prom-node01 ~]# curl -s http://localhost:9100/metrics |head -10 | |
# HELP go_gc_duration_seconds A summary of the pause duration of garbage collection cycles. | |
# TYPE go_gc_duration_seconds summary | |
go_gc_duration_seconds{quantile="0"} 3.066e-05 | |
go_gc_duration_seconds{quantile="0.25"} 3.523e-05 | |
go_gc_duration_seconds{quantile="0.5"} 3.7351e-05 | |
go_gc_duration_seconds{quantile="0.75"} 3.9952e-05 | |
go_gc_duration_seconds{quantile="1"} 0.000122787 | |
go_gc_duration_seconds_sum 0.000496506 | |
go_gc_duration_seconds_count 11 | |
# HELP go_goroutines Number of goroutines that currently exist. |
# 4.5 配置 Prometheus
1、修改 Prometheus 配置,添加新的 Job 分组,然后将对应的节点纳入监控中;
[root@prom-node01 ~]# cat /etc/prometheus/prometheus.yml | |
# 全局段定义 | |
global: | |
scrape_interval: 15s # 设置 Prometheus 抓取指标数据的间隔,默认为 15 秒。 | |
# 抓取指定的目标 | |
scrape_configs: | |
- job_name: "prometheus" # 定义一个抓取任务,名为 'prometheus'。 | |
metrics_path: "/metrics" # 指定 Prometheus 从监控目标暴露的 HTTP 端点路径抓取指标,默认为 '/metrics'。 | |
static_configs: # 配置静态目标地址,Prometheus 将定期从如下这些地址抓取指标。 | |
- targets: ["prom-node01.oldxu.net:9090"] | |
- job_name: "grafana" | |
metrics_path: "/metrics" | |
static_configs: | |
- targets: ["prom-node01.oldxu.net:3000"] | |
- job_name: "node_exporter" | |
metrics_path: "/metrics" | |
static_configs: | |
- targets: ["prom-node01.oldxu.net:9100","prom-node02.oldxu.net:9100","prom-node03.oldxu.net:9100"] |
2、重新加载 Prometheus
[root@prom-node01 ~]# curl -v -X POST http://localhost:9090/-/reload | |
* About to connect() to localhost port 9090 (#0) | |
* Trying ::1... | |
* Connected to localhost (::1) port 9090 (#0) | |
> POST /-/reload HTTP/1.1 | |
> User-Agent: curl/7.29.0 | |
> Host: localhost:9090 | |
> Accept: */* | |
> | |
< HTTP/1.1 200 OK | |
< Date: Thu, 22 Feb 2024 13:35:56 GMT | |
< Content-Length: 0 | |
< | |
* Connection #0 to host localhost left intact |
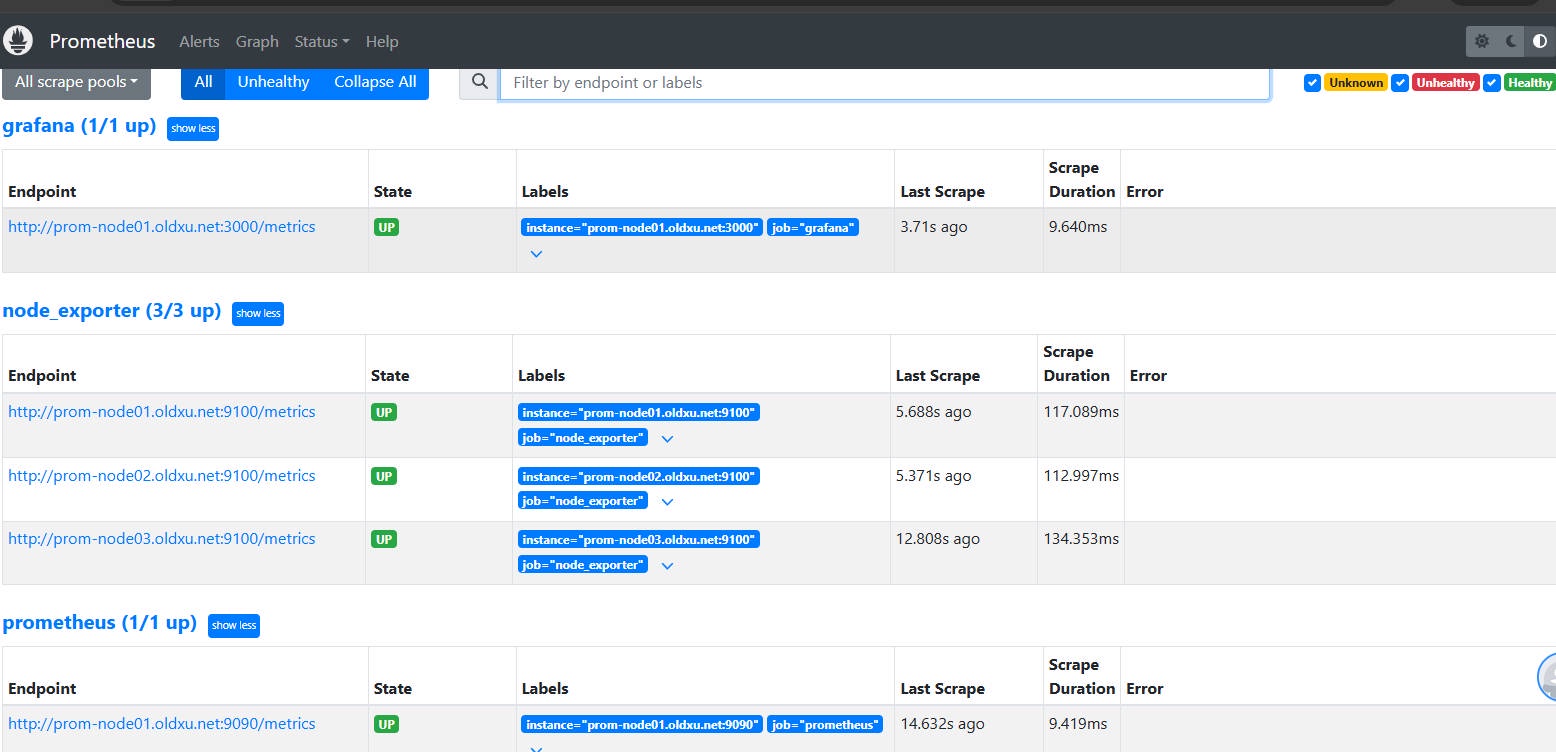
3、检查 Prometheus 是否已将对应节点纳入监控(点击 Status-->Targets)
# 4.6 导入 Grafana 模板
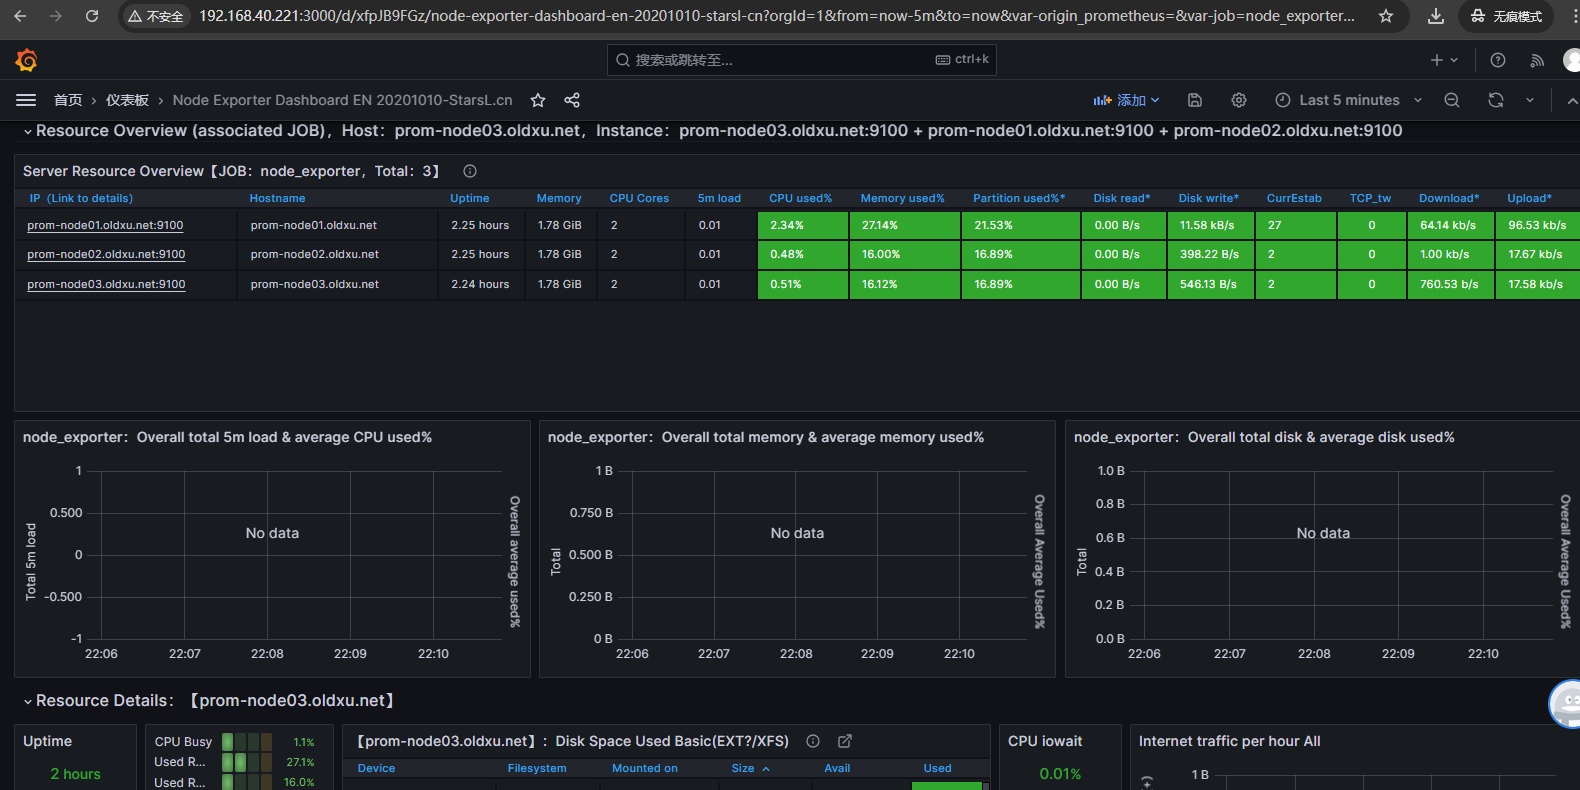
在 Grafana 的官方插件库中,有很多 Node-exporter 模板。其中相对受欢的模板的 ID 是: 11074、1860。
- 11074:模板包括了 CPU、内存、磁盘、网络、温度传感器等指标(常用)。
- 1860:模板包括 CPU、内存、磁盘、网络等。这运行状况,及时发现潜在问题并进行调优。
# 五、node_exporter 常用指标
# 5.1 CPU 与内存相关指标
1、CPU 负载相关核心指标
| 指标名称 | 指标类型 | 指标含义 |
|---|---|---|
| node_load1 | gauge | 过去 1 分钟的系统平均负载。 |
| node_load5 | gauge | 过去 5 分钟的系统平均负载。 |
| node_load15 | gauge | 过去 1 5 分钟的系统平均负载。 |
2、CPU 使用相关核心指标
| 指标名称 | 指标类型 | 指标含义 |
|---|---|---|
| node_cpu_seconds_total | Counter | CPU 在不同模式下使用的时间(以秒为单位)。 |
3、内存相关核心指标
| 指标名称 | 指标类型 | 指标含义 |
|---|---|---|
| node_memory_MemTotal_bytes | gauge | 系统总内存量(以字节为单位)。 |
| node_memory_MemAvailable_bytes | gauge | 系统当前可用的内存量(以字节为单位)。 |
| node_memory_Cached_bytes | gauge | 系统缓存使用的内存(以字节为单位)。 |
| node_memory_Buffers_bytes | gauge | 用于缓冲使用的内存(以字节为单位)。 |
计算可用内存百分比: node_memory_MemAvailable_bytes /node_memory_MemTotal_bytes * 100
计算已用内存百分比:(node_memory_MemTotal_bytes - node_memory_MemAvailable_bytes) /node_memory_MemTotal_bytes *
100
4、SWAP 相关核心指标
| 指标名称 | 指标类型 | 指标含义 |
|---|---|---|
| node_memory_SwapTotal_bytes | gauge | 系统交换空间总量(以字节为单位)。 |
| node_memory_SwapFree_bytes | gauge | 系统未被使用的交换空间(以字节为单位)。 |
# 5.2 磁盘与网络相关指标
1、磁盘空间相关核心指标
| 指标名称 | 指标类型 | 指标含义 |
|---|---|---|
| node_filesystem_size_bytes | gauge | 文件系统大小(以字节为单位)。 |
| node_filesystem_avail_bytes | gauge | 文件系统可用空间(以字节为单位)。 |
计算可用空间百分比: node_filesystem_avail_bytes /node_filesystem_size_bytes * 100
计算已用空间百分比:(node_filesystem_size_bytes - node_filesystem_avail_bytes) /node_filesystem_size_bytes * 100
2、磁盘 Inode 相关核心指标
| 指标名称 | 指标类型 | 指标含义 |
|---|---|---|
| node_filesystem_files | gauge | 文件系统中 inode 能使用的总数。 |
| node_filesystem_files_free | gauge | 文件系统中空闲 inode 的数量。 |
计算已用的 Inode 百分比: (node_filesystem_files - node_filesystem_files_free) /node_filesystem_files * 100
3、磁盘 IO 吞吐量相关核心指标
| 指标名称 | 指标类型 | 指标含义 |
|---|---|---|
| node_disk_read_bytes_total | Counter | 从给定设备读取的总字节数。(以字节为单位)。(使用 irate 可以得到每秒写入大小) |
| node_disk_written_bytes_total | Counter | 向给定设备写入的总字节数。(以字节为单位)。(使用 irate 可以得到每秒写入大小) |
4、磁盘 IOPS 相关核心指标
| 指标名称 | 指标类型 | 指标含义 |
|---|---|---|
| node_disk_reads_completed_total | Counter | 磁盘设备完成的读操作总数。(使用 irate 可以得到每秒读操作的平均数) |
| node_disk_writes_completed_total | Counter | 磁盘设备完成的写操作总数。(使用 irate 可以得到每秒读操作的平均数) |
5、网络核心指标
| 指标名称 | 指标类型 | 指标含义 |
|---|---|---|
| node_network_receive_bytes_total | Counter | 网络接口接收到的总字节数。(以字节为单位)。 |
| node_network_transmit_bytes_total | Counter | 网络接口发送出去的总字节数。(以字节为单位)。 |
6、连接追踪核心指标
| 指标名称 | 指标类型 | 指标含义 |
|---|---|---|
| node_nf_conntrack_entries | gauge | 系统正在跟踪的网络连接的数量。这包括所有类型的连接 TCP, UDP、ICMP 等 |
| node_nf_conntrack_entries_limit | gauge | 系统 conntrack 能够跟踪的网络连接的最大数量。读取的是 /proc/sys/net/netfilter/nf_conntrack_max,内核参数为:net.netfilter.nf_conntrack_max) |
计算连接追踪使用百分比: node_nf_conntrack_entries /node_nf_conntrack_entries_limit * 100
# 5.3 TCP 与其他相关指标
1、TCP 相关核心指标
| 指标名称 | 指标类型 | 指标含义 |
|---|---|---|
| node_tcp_connection_states | gauge | 当前已断开的 TCP 连接数。 |
| node_tcp_connection_states | gauge | 当前建立的 TCP 连接数。 |
2、文件描述符
| 指标名称 | 指标类型 | 指标含义 |
|---|---|---|
| node_filefd_maximum | gauge | 当前系统最大可用的文件描述符数量(由 fs.file-max 内核参数设定,具体读取的文件 /proc/sys/fs/file-max) |
| node_filefd_allocated | gauge | 当前系统已经分配的文件描述符的数量。 |
当前文件描述符已使用百分比 :(node_filefd_allocated /node_filefd_maximum) * 100
3、系统其他指标
| 指标名称 | 指标类型 | 指标含义 |
|---|---|---|
| node_time_seconds | gauge | 当前系统的时间戳 |
| node_boot_time_seconds | gauge | 系统最后一次启动的时间戳。 |
系统自启动以来,总共运行了多少天 = (node_time_seconds - node_boot_time_seconds)/ 86400